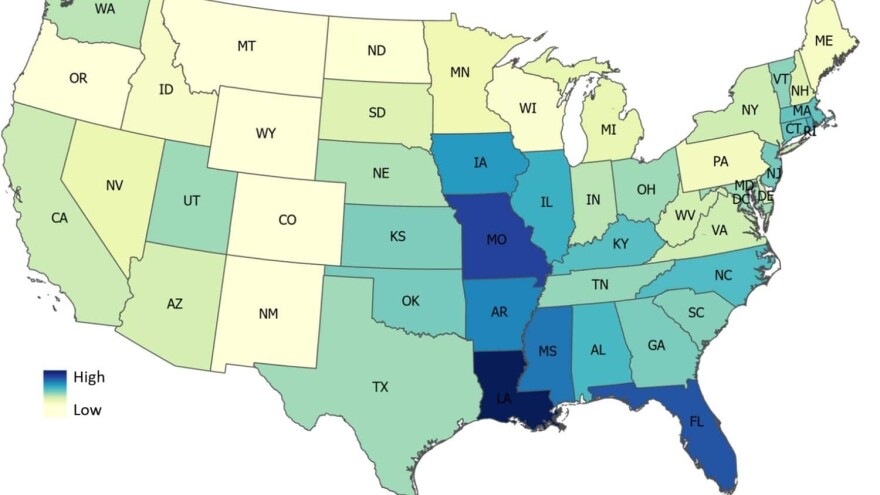
New out of N.C. State University shows the state and nation could be underestimating flood damage risk.
Researchers from the university's Center for Geospatial Analytics used artificial intelligence to predict where flooding is likely to happen. Researchers used data from actual flooding events, as well as information about distance to a river or stream, type of soil, and precipitation, to build the computer models, which in turn made predictions about flooding.
Findings, published in , showed high probability of flood damage for more than 1 million square miles of land across the United States, far greater than flood risk zones identified in flood maps produced by the Federal Emergency Management Agency. In fact, 85% of the damage reports from the National Oceanic and Atmospheric Administration were outside FEMA's high-risk flood areas.
"So this is potentially an indication that there are communities across the nation that are susceptible to damage that our current flood damage policies are not considering," said Georgina Sanchez, a research associate in the center and co-author of the study.

The study analyzed the continental United States. Of the 30 most high-risk counties, there were three in North Carolina: Dare, Hyde, and Tyrrell. Study lead author Elyssa Collins noted that New Hanover and Brunswick counties were also at high risk and had some of the highest instances of areas of disagreement with existing FEMA maps.
"Our models are not based in physics or the mechanics of how water flows; we're using machine learning methods to create predictions," Collins said. "We developed models that relate predictors – variables related to flood damage such as extreme precipitation, topography, the relation of your home to a river – to a data set of flood damage reports from the National Oceanic and Atmospheric Administration. It's very fast – our models for the U.S. watersheds ran on an average of five hours."
Collins added this was not a climate change study and did not focus on the effects of sea-level rise. She said that could be another layer of information to add to the study in the future.
Collins and her team hope this study can be used by policymakers and land-use planners as a compliment to existing FEMA maps, which can cost billions of dollars to create and maintain.
"Also, the database of flood damage reports that we use to train our model by NOAA, the National Oceanic and Atmospheric Administration, is updated every two to three months, so we can in theory take those flood damage reports that are added to the database and then add them to our model and generate these new predictions," said Collins.
This research could also help underserved communities, which can face hurdles in recovery efforts, or sometimes not even be counted at all.
"One of the things that we can do is dive deep into this data to understand what might be locations where vulnerable populations are disproportionately impacted. Especially as they are commonly unreported or unaccounted for," said Sanchez.


